This command will plot the section data from up to six section
(.SCT) files at once. The section
file can be created by several methods including
Input-Edit Section File, Sections from
Surface Entities, Digitize Sections or Process Road Design
command. A range of sections can be plotted in a vertical stack, on
section sheets, or by selecting a point that corresponds to the grid
bottom elevation.
When drawing sheets format in metric mode, be sure to set metric On (clicked) in the Drawing Setup command. Then in the Sheet Parameters dialog, set the Block Name to SCTSHT2 and set your metric sizes.
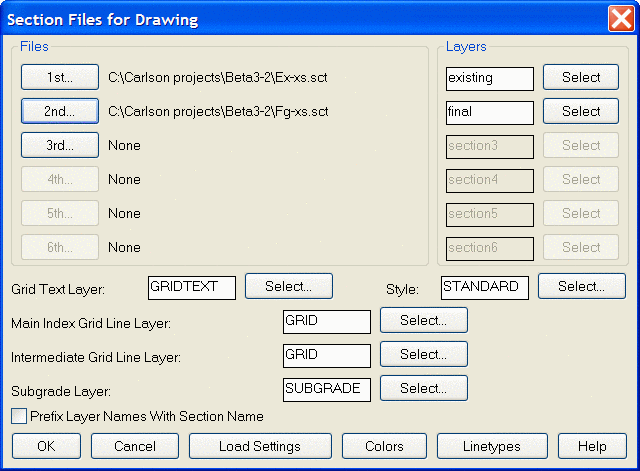
In the initial dialog, specify up to six section (.SCT) files to
plot, the layer for each, and the layer
names and text styles for the overall grid text, grid lines, and
subgrade. There is also a toggle to Prefix Layer Names with
Section Name, so that all layers created for the sections begin with
the section name. At the bottom of the dialog is a button to Load
Settings, loading a set of previously saved settings, and buttons to
set the Colors and Linetypes for the section components.
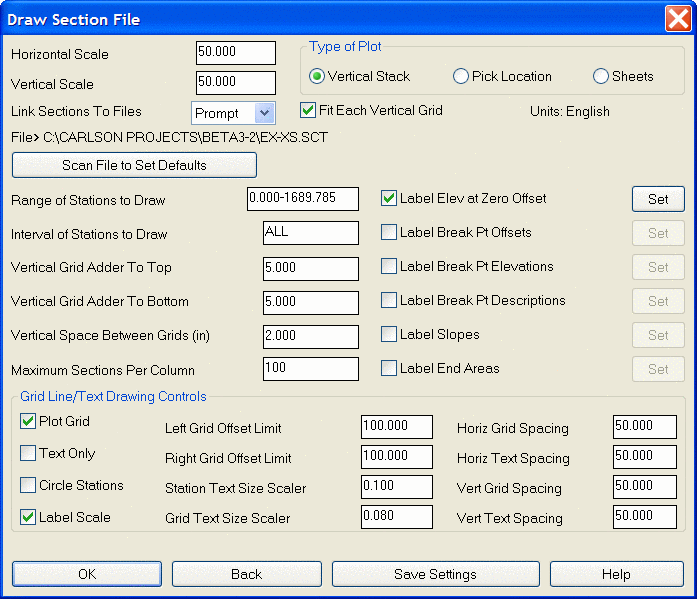
The second dialog box presents the next level of settings for the
generation of sections.
Horizontal Scale: Specify the
horizontal scale.
Vertical Scale: Specify the vertical scale.
Link Sections To Files:
This setting controls the linkage of the plotted sections to the actual
section file(s) (.SCT), determining how changes to the file affect the
plotted sections. If set to Off, there is no linkage, Prompt will
ask whether to update the plotted sections when the file changes, and
Auto will automatically update the plotted sections when the file
changes.
Type of Plot: Specify how the sections will be plotted, either
as a Vertical Stack, Pick Location, selecting
the datum point of each section, or Sheets, which will plot
the sections on a block
section sheet.
Fit Each Vertical Grid:
When checked, the grid bottom elevation
and grid height are
set automatically, and you may
specify values to add to the
top and bottom of each grid. See Vertical Grid Adder to Top and
Vertical Grid Adder to Bottom. When not
checked, the Vertical Grid Adder to Top and Vertical Grid Adder to
Bottom options change to Grid Bottom Elevation and Grid Vertical Height.
Scan File to Set Defaults: This button allows the program to set
the minimum
and maximum parameters. If you choose this option the program will
automatically
set the range of stations, vertical spacing distance, right and left
grid distances and
starting/datum elevation. This option writes a file called
"sectsort.tmp" that is read and used to set the
defaults the next time you use the program. Therefore, if you are
selecting a different .SCT file to plot
you should use this option to update the .TMP file.
Range of Stations to Draw: Specify the range of stations from
the file which will be drawn.
Interval of Stations to Draw: Specify the interval of stations
to draw. For example, perhaps
you sampled every 25 feet with the Sections from Surface
Model command for more accurate quantities but only want to plot 50
foot stations. ALL is the default value for this field.
Vertical Grid Adder to Top: Specify the distance that will be
added to the highest elevation of
the section for the sheets and pick location options. Only available
when Fit Each Vertical Grid
is checked ON.
Vertical Grid Adder to Bottom: Specify the distance that will
be subtracted from the
lowest elevation of the section for the sheets and pick location
options. Only available when Fit
Each Vertical Grid is checked ON.
Grid Bottom Elevation: Specify actual bottom elevation for each
section grid. Only available
when Fit Each Vertical Grid is checked OFF.
Vertical Grid Height: Specify actual grid height for each
section grid. Only available when Fit
Each Vertical Grid is checked OFF.
Vertical Space Between Grids: Specify the distance the sections
are stacked above the last
one plotted when drawing multiple sections.
Maximum Sections Per Column:
Sets the maximum number of sections allowed per column.
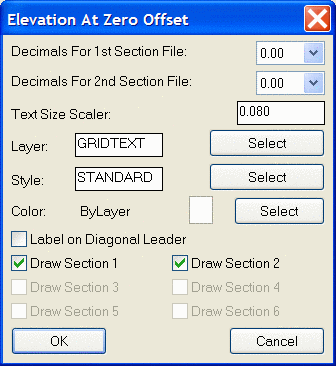
Label Elevation at Zero Offset: Will label the section
elevation
at offset zero. The label is
drawn on the section grid just above the section line. Press the Set
button to the right of this toggle
to set the display precision, text size scaler and layer for these
labels. There is also an option to
draw the elevation on a 45 degree diagonal, otherwise the elevation
label is draw vertically.
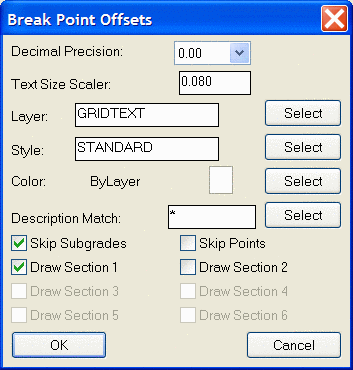
Label Break Pt Offsets: Will label these values along the
section
line
above each point in the section. Press the Set button to the right of
this toggle to
set the display precision, text size scaler and layer for these labels.
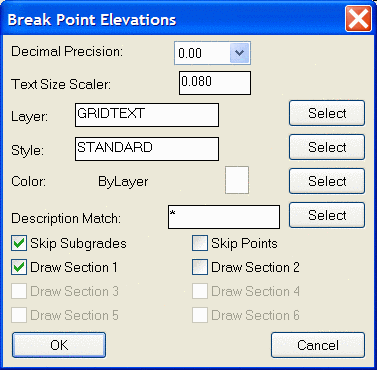
Label Break Pt Elevations: Will label these values along the
section line above each point in
the section. Press the Set button to the right of this toggle to set
the
display precision, text size scaler and layer for these labels.
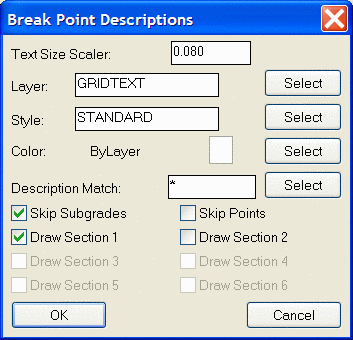
Label Break Pt Descriptions: Will label these values along
the
section
line above each point in the section. Press the Set button to the right
of this
toggle to set the text size scaler, layer, and description match for
these labels.
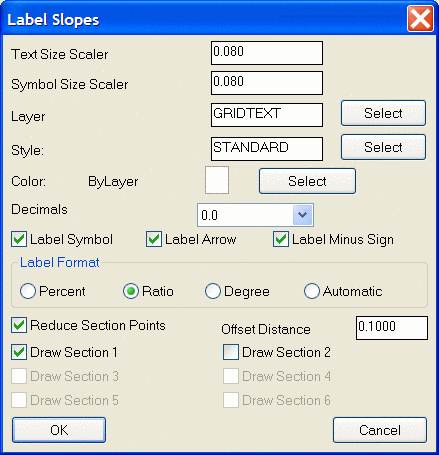
Label Slopes: Will draw in the slopes.
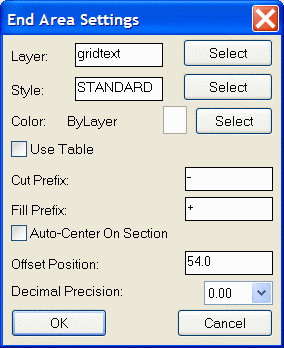
Label End Areas: Will label cut and fill quantities on each
section.
Use Table: Puts
end areas cut/fill values in table.
Grid Line/Text Drawing Controls
Plot Grid: Uncheck this toggle if you do not want the grid to
plot.
Text Only: Check this toggle if you only want to plot the cross
section polyline and the grid text.
This can be useful for plotting on a section sheet that has pre-plotted
grid lines and you want
to plot only the section and text.
Circle Stations: Will draw the station number with a
circle around it on the
left and right sides of the section grid.
Label Scale: Will label the horizontal and vertical scale on
each
section.
Left Grid Offset Limit: Specify the length the grid lines are
plotted to
the left from the centerline or
zero offset.
Right Grid Offset Limit: Specify the length the grid lines are
plotted to
the right from the centerline
or zero offset.
Station Text Size Scaler: Specify the text size scaler for the
station
text. This value is multiplied by
the horizontal scale to obtain the final text height. For example, if
you set Station Text Size to 0.10
and the horizontal scale is 100.0, then the text height will be (0.10 X
100) or 10.0.
Grid Text Size Scaler: Specify the text size scaler for the axis
text.
This value is multiplied by the
horizontal scale to obtain the final text height. For example, if you
set Axis Text Size to 0.08 and the
horizontal scale is 50.0, then the text height will be (0.08 X 50) or
4.0.
Horiz Grid Spacing: Specify the distance the vertical
lines of the grid will be spaced.
Horiz Text Spacing: Specify the interval that text
will be plotted below the grid lines.
Vert Grid Spacing: Specify the distance the horizontal
lines of the grid will be spaced.
Vert Text Spacing: Specify the interval that text will be
plotted to the left and right of
the grid lines.
Select the OK button at the bottom of the dialog to begin plotting. For the Vertical Stack and Pick Location options, you are prompted to specify a starting point for the sections. If Sheet option was selected, another dialog appears to specify all the settings for sheet plotting, see details below.
Select Starting Point for Row of Sections pick a point
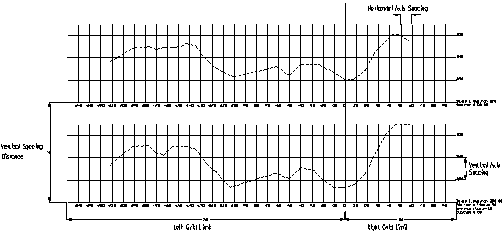
 |
|
Vertical Stack layout |
The Pick Location type of plotting has the following prompts:
Station> 4000.000 Min Elev> 462.849 Max Elev> 472.091
Change datum elev/<Select point that represents 0 offset elev
460.0>:
C
Starting-Datum Elevation: 450
The program scans the station data and determines the minimum and
maximum elevations,
and proposes a datum elevation. If you have pre-plotted a grid sheet
and want to reference
another local grid coordinate, then change the datum elevation
appropriately.
Change datum elev/<Select point that represents 0 offset elev
450.0>: pick a point
Station> 4025.000 Min Elev> 463.332 Max Elev> 472.385
Change datum elev/<Select point that represents 0 offset elev
460.0>: pick a point
The program continues to prompt until the last station in the range
specified is drawn. You can
use the Cancel function ([Ctrl] + [C]) to stop plotting, if necessary.
If you chose the Vertical Stack option you will be prompted for the
starting point for the row
of sections. If you selected the Sheets option, and press the OK
button,
the Section File Sheet
Drafting Parameters dialog appears, allowing you to set up how you want
the section sheets plotted.
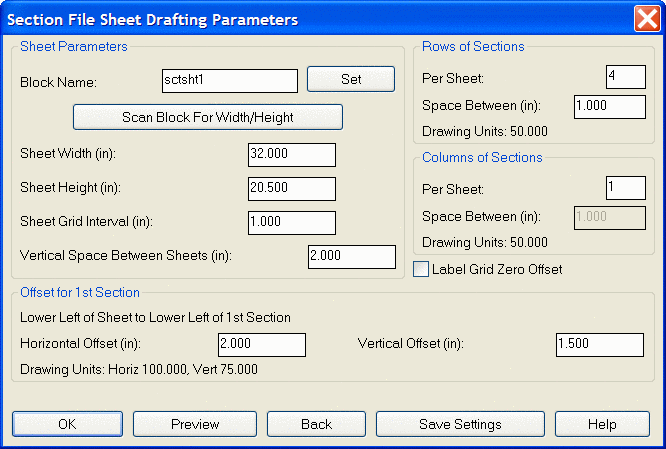
Sheet Parameters
Block Name: Specify the AutoCAD drawing name that will be
inserted for each sheet. The
default is SCTSHT1 which is included with Carlson 2007, and is stored
in
the \SUP directory. You can
use this or use a sheet block of your own design. The block should be
drawn at a 1 = 1 scale since
the program inserts it at the horizontal scale setting from the
previous dialog.
Distance Between: Controls the distance from the bottom of one
sheet and the bottom of the next.
Rows of Sections
Per Sheet: Controls how many sections will be stacked on top
of each other on a sheet.
Distance Between: Controls how much space will be placed between
the top of the last
section plotted and the bottom of the next section. The distance
between and other values in this
dialog are in AutoCAD units. In our above example we are set to 20
horizontal scale so 20 would
equal 1 inch when plotted. It is recommended that you set the
horizontal and vertical scales in the
previous dialog before accessing the sheet parameters dialog so that
reasonable defaults will be
set automatically.
Columns of Sections
Per Sheet: Controls how many rows of sections will be plotted
on each sheet.
Distance Between: Controls the distance that the rows of section
will have between the
centerline of the one section row and the next centerline of rows. This
edit box can only be accessed if
you have a number of columns greater than one. For example, if you want
15 inches between the
columns, specify 300 (15 x 20).
1st Section Offset from
Lower Left of Sheet to CL: X and Y edit boxes allows you to
specify where the first section of
the first row will be placed relative to the lower left of the section
sheet. In our example we
specified 160 (8 inches at 20 scale) and 15 (1.5 inches at 20 scale).
The Block SCTSHT1 has a half inch
border before the 1st grid line and we want to plot starting at the
second grid line, which is another
inch from the bottom of the sheet. We want the centerline of the first
section to be slightly left of
the center of the sheet which is 33.5 inches wide so we specify 15
inches (300 at 20 scale).
Previous: This button allows you to return focus to the main
dialog and make changes to
settings or cancel the program. One thing to remember when plotting
sheets with grid lines on them is
to switch on the Text Only toggle on so you don't get duplicate grid
lines.
Label Grid Zero Offset:
Save Settings: This button allows you to save all the parameters
settings to a file so you can
easily recall them for another project.
Load Settings: This button allows you to recall the settings
saved with the option explained above.
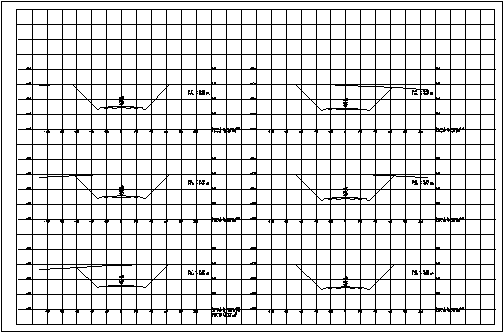
When you select the Layers button this dialog appears allowing you to specify the layer that the files are plotted on. If you are specifying a new layer to create, type the name into the edit box. If you want to select a layer that already exists from the layer list, then click on the Select... button to the right of the edit box. When you select the OK button the program prompts for the starting point for the row of sheets. The default is coordinate 0, 0 though you can select any point you like. With the settings shown in the example dialogs the sections would be plotted as shown below.
Drawing Metric Section Sheets
First, be sure that you are set to metric mode in
Drawing Setup under the Settings menu.
Then set the scales and spacing as shown in the dialog below. This
example is 1:1000 scale. When
the first dialog is set, click OK to reach the second dialog. There is
a different block name for
metric sections called schsht2.dwg. This file is located in the
Carlson 2007 SUP directory. Choose
the parameters for the second dialog as shown. In this
case the sheets will have
two rows and two columns of sections.
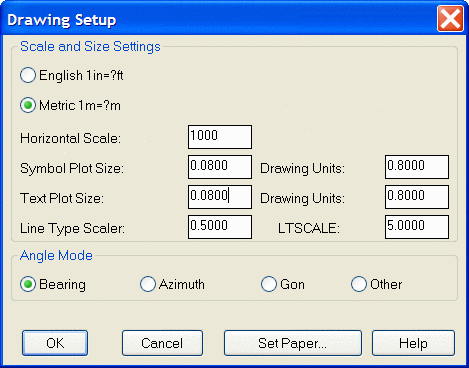 |
| Drawing Setup dialog with metric 1m=?m setting from Settings menu |
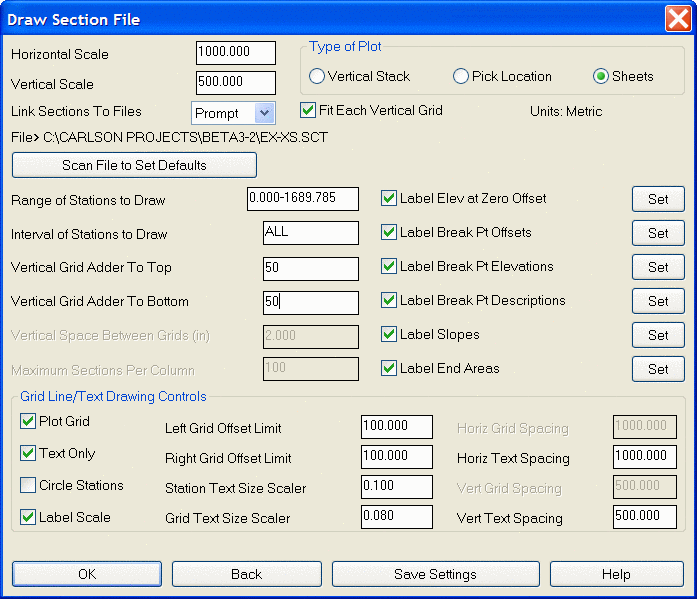 |
| First dialog with metric settings |
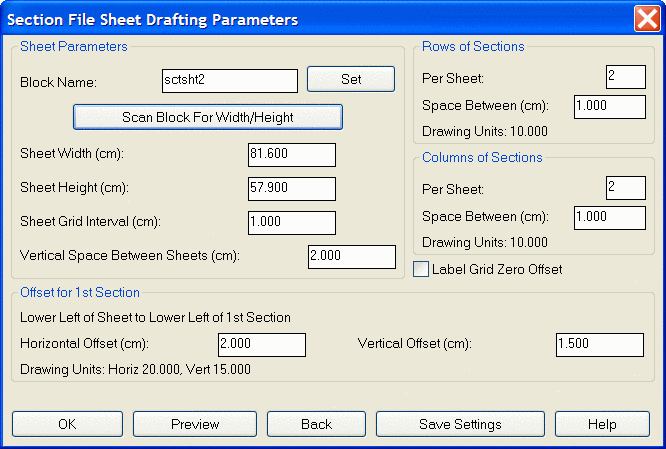 |
| Second dialog with metric settings |
Pulldown Menu Location: Sections
Keyboard Command: drawsct
Prerequisite: An .SCT file
File Names: \lsp\drawsct.lsp, \lsp\scadprof.dcl,
\lsp\drawsct.arx