The Range Diagram routine enables detailed cross-section quantity estimation of surface mining with draglines on parallel pits. This command is only used for single seam mining. It uses the same input parameters for all the pits. The grids must be in top down order by elevation, so the top of coal grid cannot be above the surface topography.
The Range Diagram command presents a section view of the mining progress perpendicular to the direction of the pits. Each individual pit has uniform cut width, highwall slope and spoil slope. The purpose of the Range Diagram routine is to produce quantities by pit and to crate a new, output section file. The final cut and spoil piles are represented as a final ".SCT" file that can be plotted or converted to 3D polylines and contoured.
Inputs: The first file needed is an ".MXS" file for locating the cross sections. This file is made in the Sections and Profiles menu under Sections, Input-Edit Section Alignment. This MXS offset should be centered in each pit. For example, if the pit width is 150, and the MXS limit on one side is 1500, there there will be 10 pits advanced in that direction. The other files needed before running the command are three grids: Surface Topography, Top of Coal, and Base of Coal. These four files are prompted for at the beginning of the routine. Once selected, then the input screen appears.

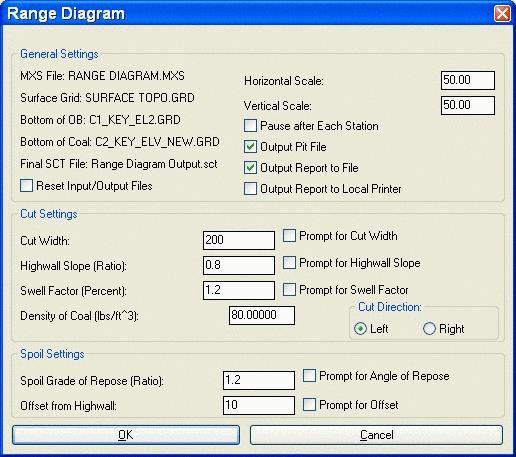
Data inputs include:
Reset Input/Output files will prompt for four new files before
running the command. Pause after Each Station does just that for
changing the input. Output Pit File is required for the Range Diagram
Timing routine. Output Report to File gives a nice report for viewing
with a text editor. Output to Local Printer sends the report directly
to the printer. In the Cut Settings section, the Cut Width is entered
in feet or meters. The Highwall Slope is entered as a ratio, horizontal
to vertical. The Swell Factor is entered as a percentage above or below
1. 1.2 is a swell factor of 20 percent. All 3 of these can be prompted
for at the end of each pit if the appropriate box is checked next to
the window. The Density is defaulted to 80. The Cut direction is
important to note. If you look down the line that was drawn to create
the MXS file in the direction it was drawn, then the pits/cuts will
advance to the left or right from that. In the Spoil Settings section,
the Spoil Slope is entered as a ratio and the Offset from Highwall is
the distance that the spoil toe will be away from the bottom of coal.
These also can be prompted for if their boxes are checked.
When executing the command, it prompts to select a starting point to begin drawing. This is the location it will draw the sections. It will also split the screen to run the volume calculations, but when done, it prompts to "return to previous view?".
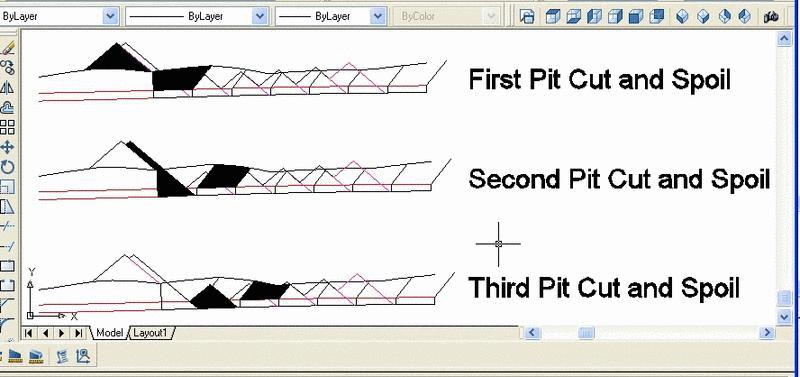
The first cut will place the spoil on top of the existing ground surface using the spoil offset distance it received in the Range Diagram Settings menu (unless the "Prompt for Offset" box has been checked which will allow you to set the offset for each pit). This can be a box cut. If it is not a box cut, make sure the top and bottom of coal grids do not rise above the surface topo grid in the pit. This can be remedied with Grid File Utilities. The first cut will also use the highwall ratio on both left and right sides of the box cut.
The second cut will place the spoil starting in the first pit and will pile it against the first spoil or highwall at a point depending on the size of the second cut. Show here are 3 pits, hatched for clarity on where each cut and spoil is.
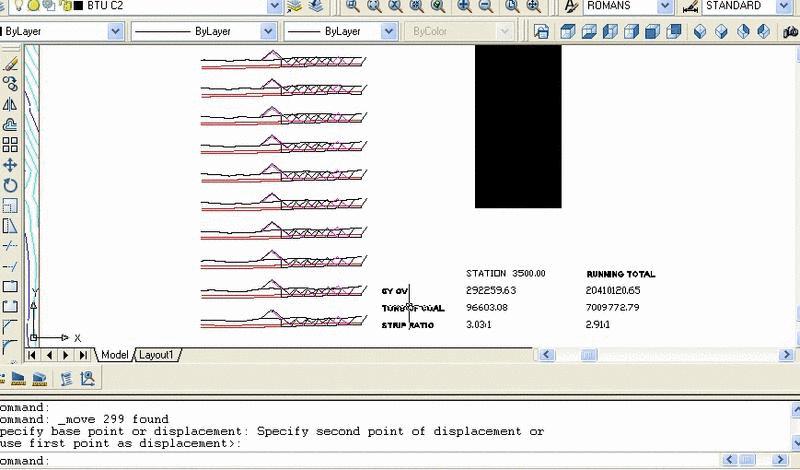
The output for the Range Diagram routine will illustrate the total quantities achieved in the report text file as well as a sectional view of each station. Each station is given the name from its ".MXS" file, relating it by distance to the first station. The output maintains a running total of quantities as well as a total for the current station. Once the first station has received its values for cut width, highwall slope, etc., the Range Diagram routine will automatically continue with the remaining stations, filling in the appropriate values for each pit since they remain the same.
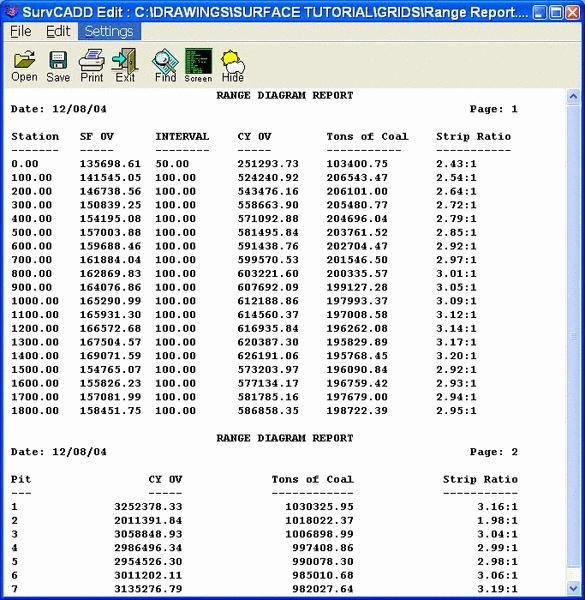
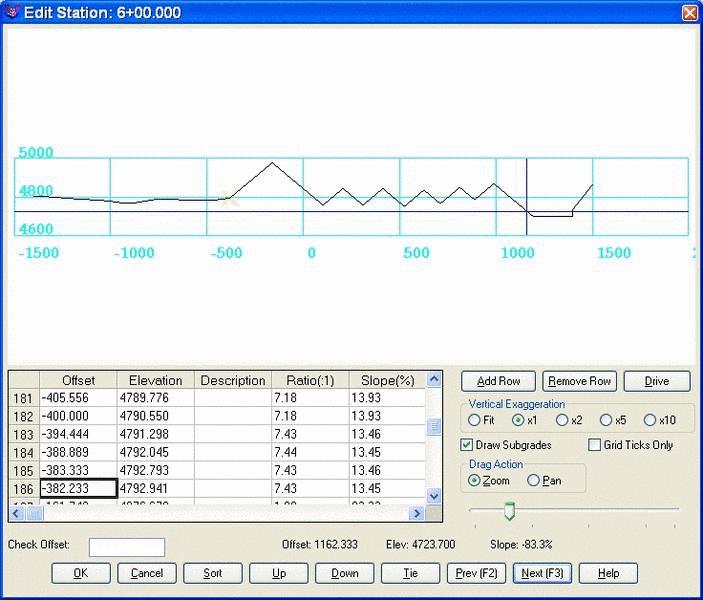
The output section file (SCT) is shown here in the Input-Edit Section file window. This SCT file is the finished spoiled surface, with the coal removed and the cuts swollen, that can be converted to 3D with Section Utilities.
Pulldown Menu Location: Surface
Keyboard Command: ranged
Prerequisite: MXS file, and three grid files
File Names: \lsp\range.arx, \lsp\ranged.lsp, \lsp\ranged.dcl